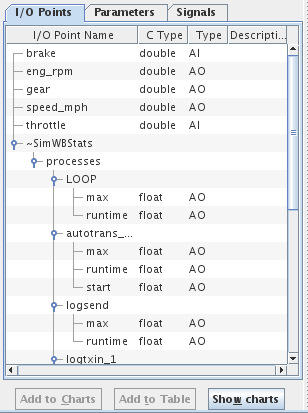
The variable list pane, on the left side of the Real-Time Viewer panel, lists all memory resident variables in the RTDB of the currently running test. It updates dynamically when different tests are run. The points are arranged in three tabs.
I/O points are variables that are created in the points forms of the Control Center. They can be mapped to hardware channels or message fields. See Mapping I/O Points to Hardware. I/O point names with periods in them are presented hierarchically.
Parameters and Signals are the tunable parameters defined by the Simulink™ models. These names have forward slashes in them and are also presented hierarchically. The hierarchy represents the Simulink™ sub systems the parameters belong to. The top level of the hierarchy of a variable is the name of the instance of the model the variable is from.
Multiple variables may be selected from the tables using control-click and shift-click, but selections may only be made from one tab at a time. The most recently clicked-on variable is displayed in the form at the top of the Get/Set Value tab. See Get/Set Value Tab (Upper Right Pane).

Expands the hierarchy tree for all variable names in the variable list tables. I/O Point names with periods or parameter and signal names with forward slashes in the names are hierarchical names and are displayed as a tree. For example, A.ai000 and A.ai001 would display ai000 and ai001 as children of the A node.

Collapses the hierarchy tree for all point names in the point table to show just the top level nodes.
Displays in the variable tables only variables whose name matches the regular expression. See Regular Expressions.
Name of the I/O point.
C language type of the I/O point. Tables will have their dimensions specified in square brackets after the C type.
Abbreviation of the kind of point this is. The first letter indicates whether it is Analog, Digital, or String. The subsequent letters indicate Input, Output, or Input/Output.
Description of the point.
Name of the parameter.
Value of the parameter.
C language type of the parameter. Tables will have their dimensions specified in square brackets after the C type.
Name of the signal.
C language type of the signal. Tables will have their dimensions specified in square brackets after the C type.

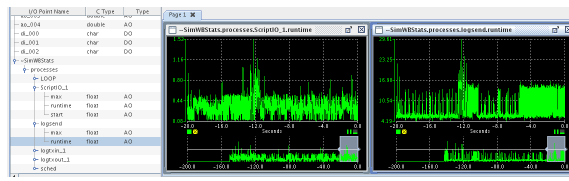
Adds charts to the Real-Time Charts window that plot the value of the selected variables against time. See Real-Time Charts.

Adds the selected variables to the table of variables whose values are displayed and updated in real time in the Get/Set Value tab (the refresh list). See Get/Set Value Tab (Upper Right Pane).

This will open the charting sub-window. Once the window is open, the user can drag a group of variables/parameters/signals from the list and drop them in the chart window. If the list group of variables is dropped in the empty chart window (as opened originally), a different charting window per variable will be created. If the group of variable is dropped onto an existing chart, the variables will be added to the current variables already in the charting window. When a chart is open, it will typically occupy all the area in the chart window. To add the group of variables being dragged as new individual plots, the group of variables can be drop on the tab.

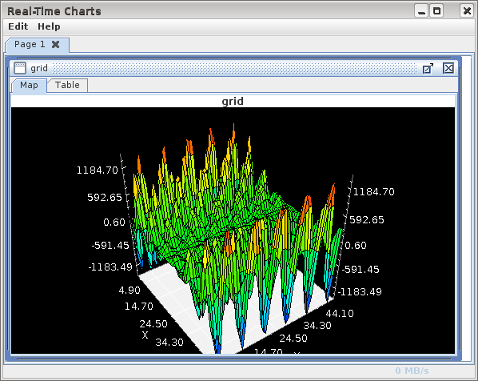
Add the variable selected in the tree as a 2D surface map.
The button is enabled when the selected variable in the tree list box is defines as a 2 dimensional matrix of at least 9 elements so that at least 3 points are available on each side to
display the surface.
If a test session has the Scheduling Stats turned on (see Logging: Scheduling Stats), additional pseudo-variables will appear in the I/O Points tab that allow the Real-Time Viewer to graph the start time, run time, and maximum run time of all the SimWB tasks.

|
Real-Time Viewer | Get/Set Value Tab (Upper Right Pane) |

|