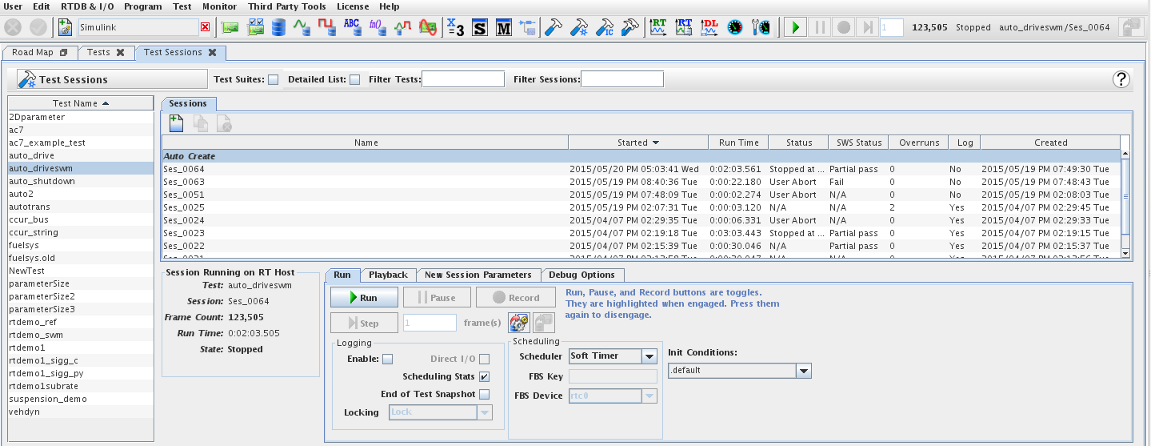
Creates, configures, and executes individual instances (called sessions) of a test run.

Creates sessions for entire suites of tests. In this mode only Auto Create is available in the sessions list.
Replaces the simple list of tests or test suites (depending on the Test Suites option) on the left side of the form with a detailed list at the top of the form. See Detailed List and Detailed List.
Displays in the test or test suite lists only tests or test suites whose name matches the regular expression. See Regular Expressions.
Displays in the sessions list only test sessions whose name matches the regular expression. Auto Create is always displayed as the first item in the list. See Regular Expressions.

Opens a short video clip that demonstrates the basic workflow of this form.

Opens this section of the manual.

Deletes the selected test session.

Creates a copy of the selected test session. Since saved test sessions cannot be edited, the alternative is to create a copy of the saved test session and make the desired changes to the copy. The copy will be assigned a unique name based on the original test’s name. Until the test is saved to the real-time host, the name can be edited.

Creates a new test session. The new test session will be assigned a unique name. Until the test session is saved to the real-time host, the name can be edited.

Commits all pending edits to the real-time host. See Apply . The Run and Play buttons are disabled if there are pending edits.

Discards all pending edits.
Simple list of tests or test suites (depending on the Test Suites option) on the left side of the form, or a detailed list at the top of the form, depending on the Detailed List option. Select a test or test suite from the list by clicking on it.
List of sessions for the selected test or test suite. Test suites only have the Auto Create session. By default, the sessions are listed in reverse chronological order of when they were last executed. Click on column headings to select a different sort order. The sessions tab is selected automatically when the Copy or New buttons are pressed.

Auto Create Session
Special session that serves as the template for automatically creating new sessions at run time (rather than reusing an existing session). When this session is executed, a new session is created copying the Auto Create session’s settings. This session may be edited at any time, whereas regular sessions may only be edited when they are newly created until they are saved to the real-time host.
Name of the session.
Time and date that the session was last executed.
Duration of the session’s last execution.
Status of the session’s last execution as reported by the scheduler.
Status of the session’s last execution as reported by an Sws/swm script.
Number of overruns the session experienced during its last execution.
Indicates whether logging data is recorded with this session or not.
Time and date that the session was created.
Controls for initiating and controlling the execution of a simulation test session.
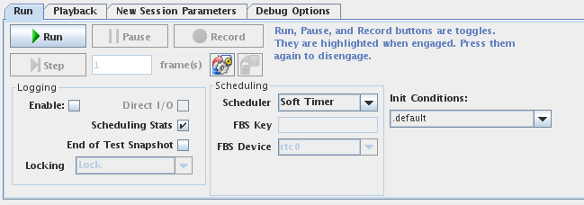

Begins execution of the selected test session. If Auto Create is selected, a new session is created and run. This is a toggle button. It will become highlighted and the label will change to Stop while a test is running. Press it again to stop the test.
If an existing session is reused, the data previously logged by the session will be lost.

Stops execution of the currently running test. This is a toggle button. It will cease being highlighted and the label will change to Run when no test is running.

Pauses execution of the currently running test. This is a toggle button. It will become highlighted and the label will change to Resume while a test is paused. Press it again to resume execution of the currently running test.

Resumes execution of the currently running, but paused, test. This is a toggle button. It will cease being highlighted and the label will change to Pause when a test is resumed.

Enables or disables the recording of logging data in the currently running test. This is a toggle button. When recording is enabled, the button is highlighted.

Executes a paused test for the specified number of frames (test cycles).

Click on this button to invoke the dialog that allows you to configure the properties of the test snapshot.
Those are the same properties described here.

Click on this button to take a snapshot of the RTDB. This button is enabled when a test is running. This button is also accessible on the Control Center main toolbar.
Displays data about the currently running or playing back test session. It is updated approximately once per second.
Name of the currently running or playing back test.
Name of the currently running or playing back test session.
Number of frames that have executed or played back.
Elapse time of the test execution or play back.
The current state of the running or playing back test.
This and the following tabs apply to the current selected test session. For new test sessions, they can be used to edit the session’s settings. Once they session is saved to the real-time host, they can only be used to examine the settings the sessions was created with or to run or play back the session.

Name of the selected session. Once a session is saved to the real-time host, its name cannot be changed. If left blank for the Auto Create session, a unique name will be generated for the newly created session when tests are run.
Description of the selected session for documentation purposes. Once a session is saved to the real-time host, its description cannot be changed.
Enables logging RTDB variable values for later playback.
Bypasses the OS cache mechanism to write the data buffers directly to disk. In this case, the data logger allocates very large internal data buffers in order to maximize disk write throughput.
The drawback of this option is that the logged date will only be written to disk once the buffers are full so the logged data will only be available when the test run is stopped (which flushes the buffer and closes the files) or when the buffers are full. Depending on how often variables change value, it can take a long time for the buffers to fill.
The advantage is that it limits the amount of memory used to the size for the internal buffers. Otherwise, the OS disk buffers can eventually consume a very large amount of system memory and hamper the real-time performance of the system.
When this option is off, the logged data is available as soon as the OS flushes its cached buffers, letting the data be extracted while the test is running.
Logs pseudo-variables in the RTDB that record information about the scheduling of the various tasks. The Real-Time Viewer may be used to examine these variables. See Scheduling Stats.
Take a RTDB snapshot at the end of the test run.
The snapshot file is stored under $PROJECTDIR/Tests/TEST_NAME/SESSION_NAME/Snapshots/ directory.
Sets the locking policy for the circular data log files. The system is configured to use a finite number of size-limited reusable logging files, configured in /etc/ccursim.conf on the real-time host. Variables can be logged to both the regular and the circular log. Circular logs need to be post-processed after a test run. This processing can take a significant amount of time and might not be complete before another test runs. Thus, the circular log files need to be locked to prevent the data logger from reusing them while they are being processed.
Wait for the next circular log file in sequence to be unlocked before taking and locking it.
Ignore the lock on the next circular log file in sequence and take and lock it immediately.
Skip locked circular logs until an unlocked one is found to take and lock.
Duration of a test cycle.
The unit in which fixed step is presented and entered is selectable. Click on the units after the field to cycle through microseconds, milliseconds, and seconds. All fields presenting the fixed step value throughout the Control Center will use the same unit and the unit choice is preserved across invocations of the Control Center.
Time limit for how long the test may run.
The unit in which run time is presented and entered is electable. Click on the units after the field to cycle through frames, milliseconds, seconds, minutes, and hours. The unit choice is preserved across invocations of the Control Center.
Run time is stored internally in frames; the time in other units will change if the fixed step is changed.
Maximum number of overruns (test cycle taking too long to complete) that will be tolerated before test execution will be terminated.
Maximum number of consecutive overruns (test cycle taking too long to complete) that will be tolerated before test execution will be terminated.
Runtime loop to process asynchronous I/O.
The unit in which asynchronous I/O run time is presented and entered is selectable. Click on the units after the field to cycle through microseconds, milliseconds, and seconds. The unit choice is preserved across invocations of the Control Center.
This is the maximum initialization time in seconds that the scheduler will allow for all SimWB programs to starts. The default is 45 seconds. After the initialization time has expired and all the SimWB programs have not finished initializing, the scheduler will abort the test with an Initialization failure error.
This is the maximum amount of time in seconds allowed for I/O shutdown after the test has completed. The default value is 10 seconds. The I/O shutdown
procedure only runs when the RTDB defines I/O mapping to output devices and the user has defined shutdown values and rate in the initial conditions associated to the test.
When shutdown conditions for specific output channels have not been defined, the I/O tasks will not set terminating values on its output channels and the last value will be
maintained on the outputs.
This is and additional time in % at the end of the cycle that the SimWB scheduler will wait for the frame to complete. The default value is 0. The value is specified as a percentage of the frame cycle time and must be between 0 % and 50 %. I.e. if you frame cycle time is 1 milli seconds a value of 20 would allow your cycle to run for 1.2 milli seconds before the scheduler resume the next cycle. Specifying this as ≠ 0 is useful only if you have sporadic overruns and you have enough idle time in the loop that the cycle can catch up during the next frames.
The initial conditions set that this session will use. Select .default to select the initial condition set that is the default for the test. See Initial Conditions....
Select a file of environment variable settings to be set before running the selected test. See Environment Variables....
Selects the main frame execution scheduling mode. Simulation Workbench provides the functionality to run the models execution loop using various type of timing sources:
| Note: Machines with only the WU8020-307 Simulation Mode license can use only the Simulation scheduling option. |
Dispatches the synchronous simulation loop via Concurrent’s Frequency-Based Scheduler (FBS). The FBS is triggered by an interrupt coming from the RCIM board. This interrupt can be connected to an internal RCIM real-time clock (rtc0, rtc1, ...) or to an external RCIM interrupt (eti0, eti1, ...). This is the most deterministic dispatch mechanism for the SimWB simulation loop.
In this configuration, the internal SimWB scheduler is very strict about overrun conditions. When the scheduler detects an overrun condition (that is, the synchronous processes have not completed execution at the end of the simulation loop), the scheduler will output a warning message about an overrun and start the next loop immediately without waiting for the overrunning one to finish. Processes running at the beginning of the loop will run in parallel with the processes that haven’t finished running at the end of the previous loop when CPU cores are available.
However, if logging processes get pushed to after their allotted frame time, the data logger will abort the running test.
Dispatches the synchronous simulation loop via the FBS. Rather than creating its own FBS scheduler, SimWB attaches to a pre-existing FBS key. An external process must program and start the FBS that will trigger SimWB.
Dispatches the synchronous simulation loop via Concurrent’s Frequency-Based Scheduler (FBS). The FBS is configured using the specified FBS Device and FBS Key.
Dispatches the synchronous simulation loop via a software timer. This can introduce significant jitter in the simulation loop but allows tests to be run on systems that lack an RCIM card.
Dispatches the synchronous simulation loop via spinning on the hardware Time Stamp Counter (TSC) until it expires. All other SimWB processes also spin on a semaphore managed by the scheduler to determine when to execute.
This mechanism is useful for very tight simulation loops where the execution time is less than 100 microseconds. By spinning on the TSC and semaphores, all system calls are avoided and there is no context switch time between processes. However, this scheduling option requires each and every SimWB process to have a dedicated CPU to run on.
Dispatches the synchronous loop via the FBS (see Default above), but is less strict with overrun.
Overruns are still detected and reported, but the SimWB scheduler will wait for all processes to finish executing before starting the next simulation loop. This can introduce jitter at the beginning of the simulation loop. But if simulation loops normally have idle time, the new loop might still finish in time to remain in sync with the RCIM trigger.
This mechanism is useful for tests that may need some extra computation when there is a change of state, but model execution on average is less than the simulation frame length.
Dispatches the synchronous simulation loop with no timing source. Overrun detection is disabled as the loop is restarted as soon as it finishes.
Only models, user models, and scripts can be run with this scheduler option. No I/O support is provided. This is not a real-time mode. This is provided so that the user can run their models as fast as possible to produce data for later analysis. This is similar to running a MATLAB™ Simulink™ model.
When this scheduling mode is selected, the synchronous loop is dispatched whenever an
interrupt is received from a remote 5565 reflective memory card. This is a slave mode similar to the modes using the FBS with a remote (eti or di interrupts).
The simulation loop will not run if interrupts are not received. The 5565 interrupt number on which to wait is determined by selecting the number from the
5565 drop down list.
Also, the 5565 reflective memory card transmits a 32 bit word whenever the remote program generates an interrupt. This word must be set by the remote application program.
The value of the 32 bit word is made available by the scheduler in the RTDB variable named 'mem5565word' if the variable exists. To access this
32 bit word make sure you create a variable with this name in the RTDB associated with the test.
When this scheduling mode is selected, the synchronous loop is dispatched whenever an
interrupt is received from a remote SCRAMNET GT reflective memory card. This is a slave mode similar to the modes using the FBS with a remote (eti or di interrupts).
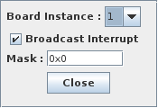
The simulation loop will not run if interrupts are not received. The type of interrupt on which to wait is configured by clicking on the SCGT Intr link.
A dialog will popup to enable
you to select Broadcast/Unicast interrupt. If broadcast is selected, you must then enter the broadcast mask (a 32 bit mask) that determine which interrupt will trigger the scheduler.
If Unicast is selected, the mask is not used since the remote interrupt sender targets the node specifically. You can also select the SCRAMNET board instance that receives the interrupt in case
you have more than one SCRAMNET board in the system.
Also, the SCRAMNET GT card transmits a 32 bit word whenever the remote program generates an interrupt. If the interrupt is sent by SimWB, this word contains the current frame count of the running test.
The value of the 32 bit word is made available by the scheduler in the RTDB variable named 'scramnetGTVal' if the variable exists. To access this
32 bit word make sure you create a variable with this name in the RTDB associated with the test.
Specifies the FBS key to be used by the frequency-based scheduler.
Specifies the FBS device to be used by the frequency-based scheduler as a real-time clock. This can be an internal RCIM real-time clock (rtc0, rtc1, ...) or an external RCIM interrupt (eti0, eti1, ...).
|
|
Options to facilitate debugging a simulation test session. These settings are parameters to the Run and Play commands and are not part of the session’s configuration. Therefore, these options can be set on a saved session.
Be advised that you must run the session via the Run tab. If you run the session via the run button located at the top-right of the GUI you will NOT be running with these options set.

Enables starting the tasks selected in the task table in the debugger. This flag is an option to the run command and is not stored as part of the session.
When running in this mode, the model is actually started and run BY THE DEBUGGER. The model may or may not be able to run in real time in this mode - you will have to experiment with it to see how it behaves in your configuration.
Simulink models wishing to catch floating point exceptions must set the '-g -DFPETRAP' compiler options when building from the MLToolkit GUI. Enabling FPE exception handling does not effect real time behavior of the model until an exception is generated. At that point, the exception is reported and the test shut down.
By defining FPEDEBUGGER, a debugger program can be started at the point of the exception. As an example, to start the NightView debugger, you could define '-g -DFPETRAP -FPEDEBUGGER="DISPLAY=pc:1 nview --attach=%d"' (note the double quotes). This will start nview, have it attach to the process and send it's display to the X server running on pc:1. The FPEDEBUGGER command expects to pass a single integer argument that represents the process ID of the model. This is filled in by the exception handler. The debugger you choose must be able to attach to a running process. NightView can do this, but kdbg can not.
Selects the X display that the debugger will display its windows on. If localhost is specified, the real-time host will set the DISPLAY variable to the system the Control Center is connecting from rather than try to display the window on the real-time host’s display.
Microsoft Windows users may want to use a third-party X display emulator (such as NoMachine NX or Hummingbird Exceed) or a VNC client to display the debugger on their Microsoft Windows display.
If you are having problems getting the debug window to appear (or getting a license for nview), look at the comments at the top of the /usr/local/ccursim/bin/debugprocess file (also available online in the SimWB Wiki FAQ).
List of tasks that can be debugged. Select tasks to be started in the debugger by clicking the check box next to the task name. Clicking the check box next to User Tasks will select all tasks. In addition to selecting tasks here, the Debug Selected Tasks option must be checked.
Enables running NightTrace’s kernel trace daemon in NightTrace while the simulation test is executing. The daemon is run in buffer wrap mode. See the NightTrace manual for details on using ntrace and ntracekd.
The trace file is stored on the real-time host as
/usr/local/ccursim/projects/Tests/testname/sessionname/kerneltrace.
The CPUs to collect trace information on. This setting is a comma separated list of individual CPUs and ranges of CPUs.
The number of buffers the daemon is to use.
The size of the buffers the daemon is to use.
Additional options to pass to the daemon. Refer to the NightTrace manual for details on what options ntracekd takes.
Controls for initiating and controlling the playback of a recorded simulation test session.
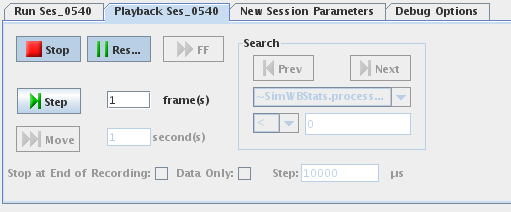

Begins playback of the selected test session. This is a toggle button. It will become highlighted and the label will change to Stop while a test is playing back. Press it again to stop playback of the test.
If the Stop at End of Recording option is selected, playback will stop at the end of recorded data, else it will run after the end of the recorded data with live data. If the Data Only option is selected, tests always stop at the end of the recorded data.
If the Data Only option is selected, recorded data is played back, but I/O tasks, the script, and models are not actually run. This allows shuttle controls that move the current time forward and backward to be enabled. See details below.

Stops execution of the test that is currently playing back. This is a toggle button. It will cease being highlighted and the label will change to Play when no test is playing back.

Pauses playing back of the currently playing back test. This is a toggle button. It will become highlighted and the label will change to Resume while a test is paused. Press it again to resume playing back of the currently playing back test.

Resumes execution of the currently playing back, but paused, test. This is a toggle button. It will cease being highlighted and the label will change to Pause when test playback is resumed.
Plays back the recorded data as fast as possible. This command is only enabled if the Data Only option is selected.

Executes a paused test for the specified number of frames (test cycles).

Moves the current time of the paused playback forward (or backward for negative numbers) the specified number of seconds. This command is only enabled if the Data Only option is selected.

Searches for the previous occurrence of the specified condition in the paused playback. This command is only enabled if the Data Only option is selected.
Searches for the next occurrence of the specified condition in the paused playback. This command is only enabled if the Data Only option is selected.
Variable whose value is being tested against in the search.
Relationship the search variable must have with the search value to satisfy the search.
Value the search variable is being tested against in the search.
Stops playback at the end of the recorded data. If not selected, execution of the test will continue with live data. If the Data Only option is selected, execution stops at the end of the recorded data regardless of the setting of this option.
If the Data Only option is not selected, the complete simulation loop (including the input, output, script, and models) is replayed. The values that have been recorded override any value that may come from input devices or go to output devices. Since all RTDB variables may not have been logged, variables without logged values take their values from I/O devices and model outputs as in a normal test run. At the end of the recorded data, all variables will take their values as in a normal test run, unless the Stop at End of Recording option is used to stop execution of the test at that point.
If the Data Only option is selected, only the recorded data is played back through the simulation loop. No I/O, scripts, or models are executed. More shuttle controls are available since the “current time” can be moved both forwards and backwards to any arbitrary point using the FF, Move, and Search shuttle controls. A different frame rate can even be specified to cause playback to happen in fast or slow motion. Execution always stops at the end of the recorded data. This option is useful for replaying a test run through RT Viewer or HMI Displays.
Fixed step duration. This can only be edited if the Data Only option is specified.
The unit in which fixed step is presented and entered is selectable. Click on the units after the field to cycle through microseconds, milliseconds, and seconds. All fields presenting the fixed step value throughout the Control Center will use the same unit and the unit choice is preserved across invocations of the Control Center.
Displays data about the currently running or playing back test.
Name of the currently running or playing back test.
Name of the currently running or playing back test session.
Number of frames that have executed or played back.
Elapse time of the test execution or play back.
The current state of the running or playing back test.

|
Initial Conditions... | Test Chart... |

|