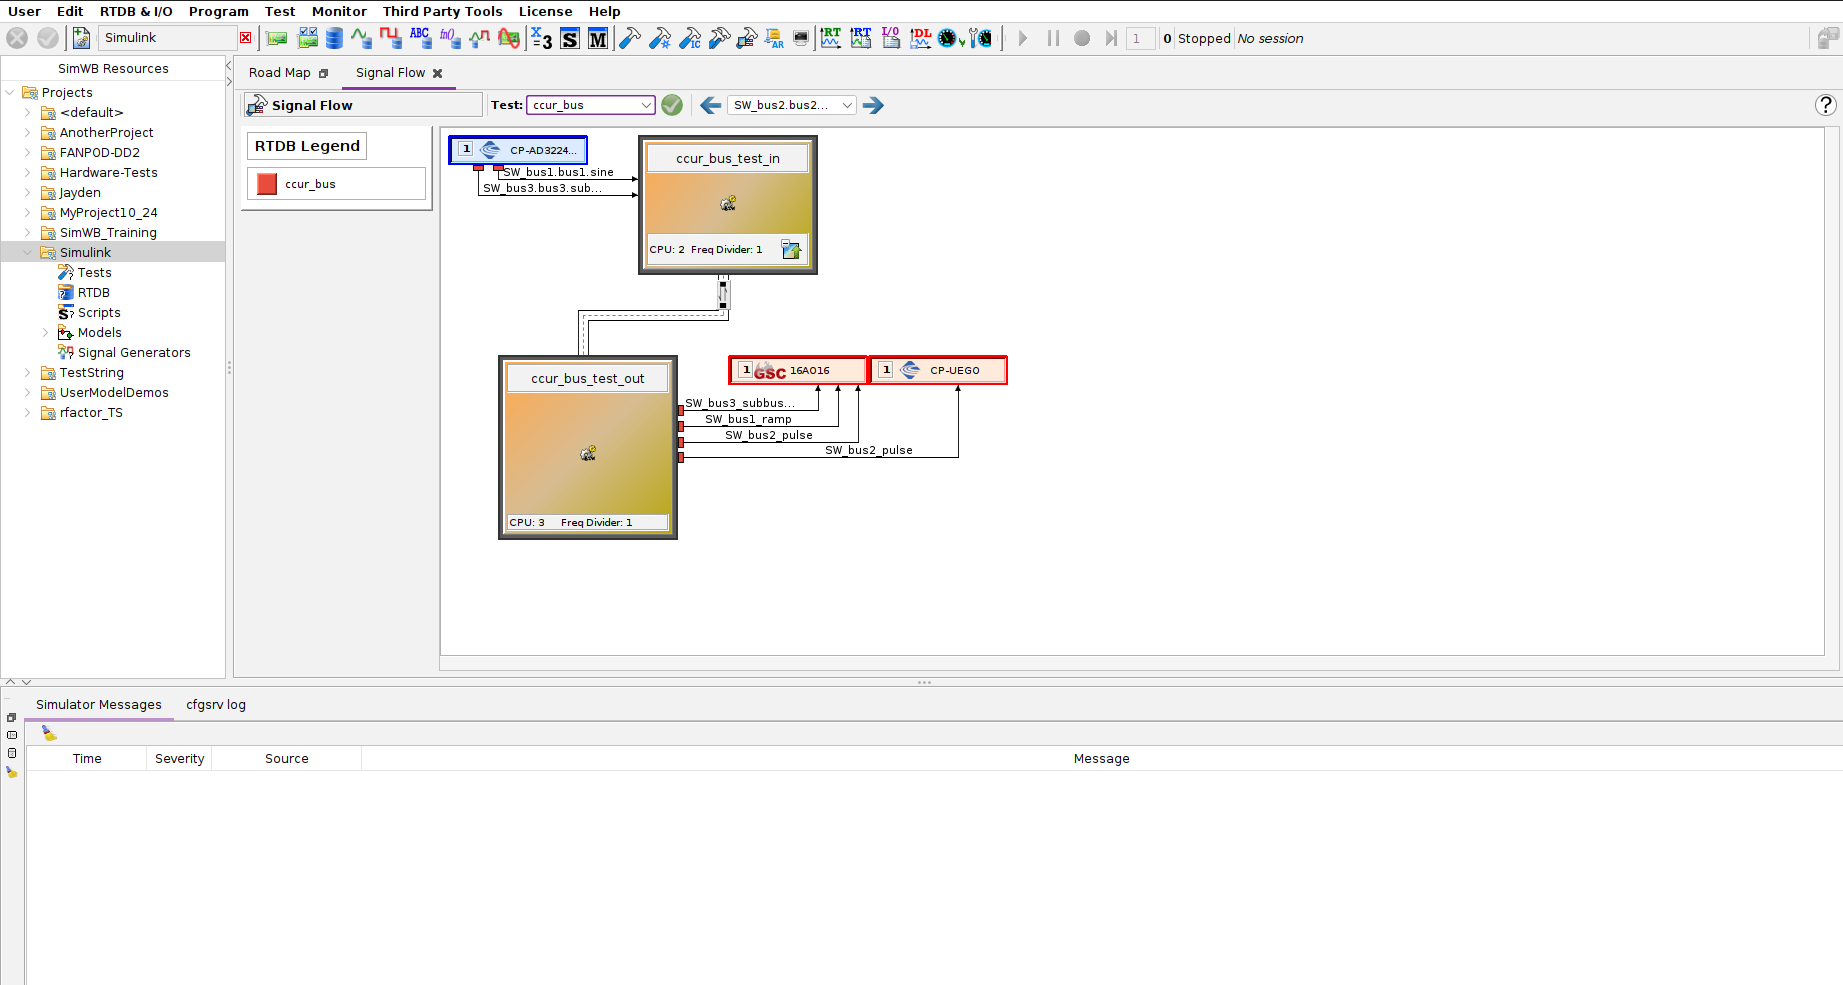
Visualize model, device, and signal interaction.
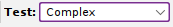
Select a test to generate a chart of.

Generates a test chart after a test has been selected in the tests combo box.

Opens this section of the manual.
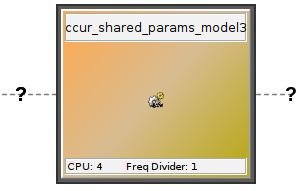
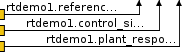
Represents a model defined in the selected test. Each model block displays CPU and frequency divider information and which models are dependent on it.
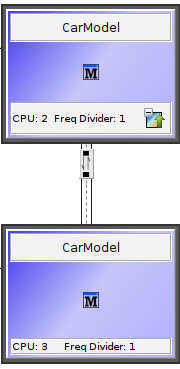
When a model has no defined input or output variables, it is considered undefined. In this case, signal connections to that model cannot be determined.
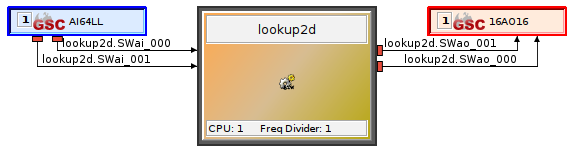
A blue rectangle that appears to the left of a model block when signals from an input device connect to that model. Represents an input device.
A red rectangle that appears to the right of a model block when signals from the model connect to an output device. Represents an output device.
Signals are mapped from input devices to models and then to output devices. The mapping is determined by the device I/O mappings associated with each signal and the variables defined within each model.
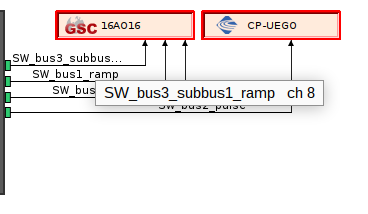
Hover over a signal name to display its full name and channel information.
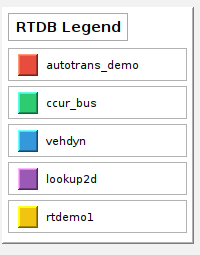
A color-coded key representing all RTDBs required by the test. Signal connections are assigned the color of their corresponding RTDB to indicate which RTDB each signal belongs to.
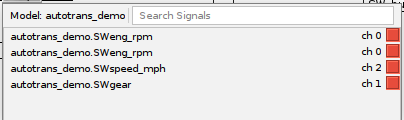
When four or more signal connections exist to or from a single input or output device, the signals are grouped into a bus. Clicking on the bus displays all signals, their associated RTDB, and the channel number assigned to each signal. A search bar allows you to search for specific signals within the bus.
Displays the signals mapped between a model and its dependent models. Selecting the bus shows the individual signal mappings and their associated RTDB.
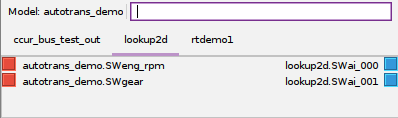
| Note: The model mapping bus displays signals mapped to child models regardless of their RTDB assignment. As a result, a signal shown in the bus is not guaranteed to originate from the model it's dependent on |

|
Test Sessions |