Displays in tabular and graphic form the execution time of the various synchronous and asynchronous tasks that are part of the running SimWB test.
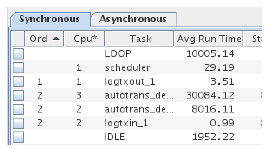
This tab shows the information pertaining to the synchronous execution of models and I/O tasks that are part of the running test.
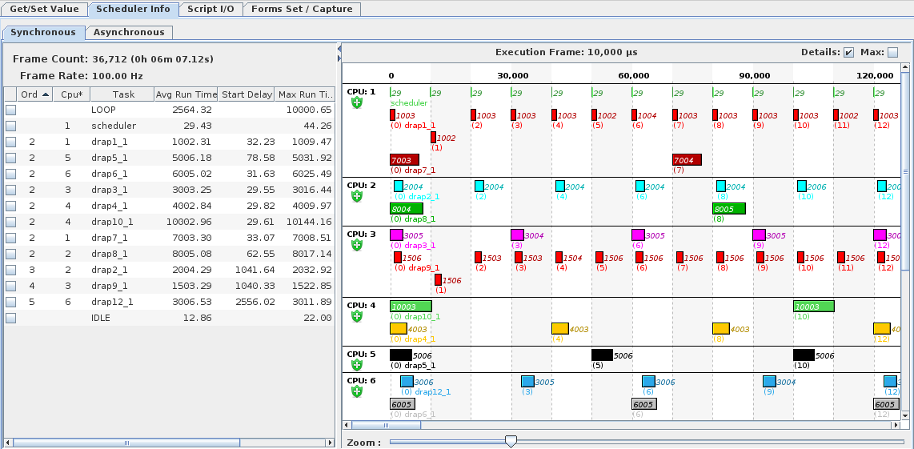
Number of test cycles that have executed since the beginning of the run. The corresponding elapsed time is shown and computed from the number of frames run and the test frame rate.
The number of cycles executed per second that the running test has been configured for.
Selects which tasks are plotted in the graph to the right of the table. If no task has its check box selected, all synchronous tasks are graphed. Click on the check box next to tasks to only graph the checked tasks. Click on the check box next to the pseudo-tasks LOOP or IDLE to clear all check boxes and graph all tasks.
Indicator of the order that tasks may begin executing.
CPU that the task is executing on. The CPU may be changed while the test is running by double clicking on the cell and typing in a new CPU number. It may take a second or two for the task to migrate to the new CPU.
Name of the task.
Moving average of the amount of time the task spends executing per test cycle in microseconds.
Maximum amount of time the task ever spent executing during a test cycle run in microseconds.
Average (since the previous update) of the amount of time from the beginning of a test cycle till the task begins executing in microseconds.
Maximum amount of time ever from the beginning of a test cycle till the task began executing in microseconds.
Process ID of the task.
Graph of the execution time of synchronous tasks running as part of the SimWB test.
This shows the execution of each task against time measured from the beginning of a test cycle.
Duration of a test cycle in microseconds.
Option to display additional details in the graph. The duration is displayed next to (or inside, if there’s room) the bar for each task, and, for threads of multirate RTW models, the cycle number the instance of the thread is associated with is prepended to the task name.
Option to also plot Max Delay and Max Run Time in the graph. This graph is a hollow rectangle the same color as the Start Delay and Avg Run Time graph, and connected to it with a line segment if the two do not overlap.
Control to permit zooming in on the time line. The range is from 1x to 100x.
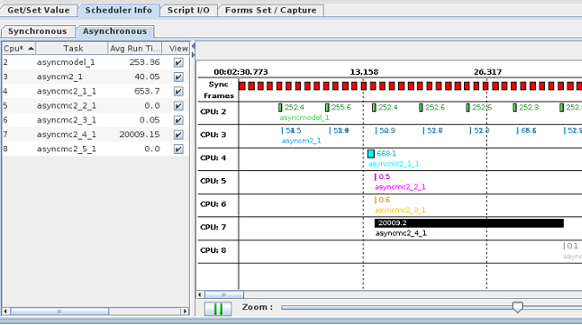
Statistics about the SimWB tasks that execute asynchronously to the test cycle.
The display shows how the asynchronous models run with respect to the execution of the SimWB synchronous loop. The red boxes at the top of display represent the synchronous frames of execution;
a maximum of 1 second of execution is shown. The display can be zoomed in / out with the slider control and can be scrolled in time with the horizontal scroll bar.
The display refresh can also be paused so it is easier to examine the sequence of executions of the multiple asynchronous models.
The rate of execution of the top models in the chain might not be congruent with the synchronous loop causing the display to flicker as the execution of some models move around the 1 second of execution displayed.
CPU that the task is executing on. The CPU may be changed while the test is running by double clicking on the cell and typing in a new CPU number. It may take a second or two for the task to migrate to the new CPU.
Name of the task.
Moving average of the amount of time the task executes when it does in microseconds.
Show/Hide the corresponding task from the chart display.
Maximum amount of time the task ever executed in microseconds.
Number of times the task has executed.
The refresh of the graphical display can be paused / resumed by clicking on this button.
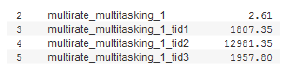 Simulink models may have multiple threads that execute at slower rates than the base rate of the simulation. These rates are always whole multiples of the base cycle time. The names of the threads are the same as the model’s base task, but with _tidn appended as illustrated in the above figure.
When a test includes a multirate Simulink model, the graphical view must be configured differently. During each test frame (aka test cycle), the list of threads which execute is variable as one thread may run every third cycle, and another every fourth. SimWB calculates the least common multiple of all the rates and graphs that many frames, painting alternating bands in the background.
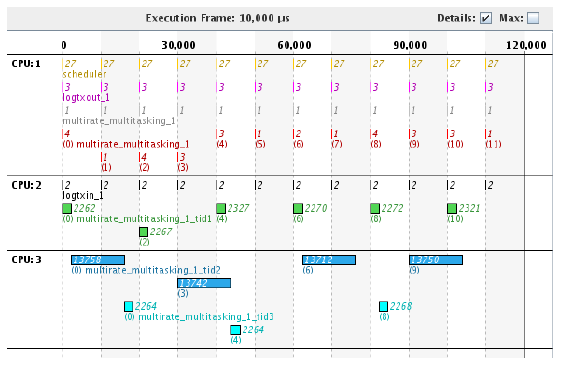
The data for non-multirate tasks and, if there are multiple multirate models, data for multirate models with smaller least common multiples are repeated.
If the Details option is selected, the frame that multirate threads are scheduled to run is displayed in parenthesis next to the start time of the thread. This is not necessarily the frame that it actually executes in. Take multirate_multitasking_1_tid3 in the above example, executing on CPU 5. It is scheduled to run every four frames: 0, 4, and 8. However, the first time it runs, it actually executes in frame 1 instead of 0. As long as it finishes before the next time it is scheduled to run, there’s no overrun.
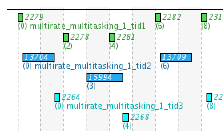 If multiple threads run on the same CPU, the higher frequency thread will preempt the lower frequency one. Note how in the graph to the right that multirate_multitasking_1_tid2 has been moved to CPU 3, which is the same CPU as multirate_multitasking_1_tid1. The instance of TID 2 scheduled for frame 3 takes noticeably longer to run now because it gets preempted by TID 1.

|
Get/Set Value Tab (Upper Right Pane) | Script I/O Tab (Upper Right Pane) |

|