y Vs x Plot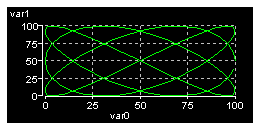
Plots two connected RTDB variables. The first connected variable is associated to the horizontal x axis while the second one is associated to the y axis.
This widget does not support user input.
Geometry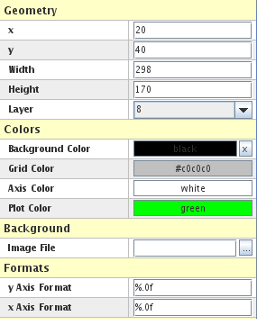
See Geometry.
Colors
Background Color
Background color of the plot.
Grid Color
Color of the grid.
Axis Color
The color for the time axis.
Plot Color
The color for the plot.
Formats
y Axis
“printf” style numerical format used to format the vertical y axis scale. HTML tags are not supported.
x Axis
“printf” numerical format used to format the horizontal x axis scale. HTML tags are not supported.
Plot Properties
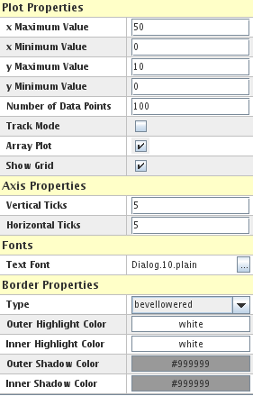
x Maximum Value
Maximum value expected for the variable connected to the x axis.
x Minimum Value
Minimum value expected for the variable connected to the x axis.
y Maximum Value
Maximum value expected for the variable connected to the y axis.
y Minimum Value
Minimum value expected for the variable connected to the y axis.
Number of Data Points
Number of data points to display. The number of data points is related to the Time span displayed by the plot via the following:
Time span (seconds) = (Number of data points)/(frame rate Hz))
|
|
Track Mode
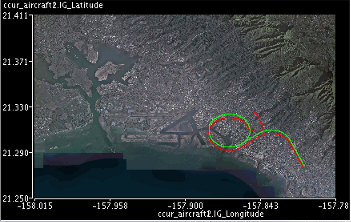
In this mode, the plot display a single pair of values (x,y) over time. This mode can be used to show the position of an object over time.
In the picture to the right we have an examples of 2 of this plots on top of each other to display the position of 2 objects.
|
|
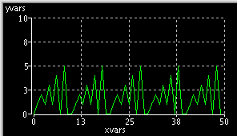
Array XY plot
This mode is used to display a true XY plot where the X and Y values are provided by connecting the plot variables to a pair of RTDB arrays. The
RTDB arrays should have the same length and the length will determine the number of pairs of data points displayed. In this mode the maximum X and Y axis ranges is not
taken into consideration. Note that this mode is incompatible with the Track Mode described above.
See picture to the right for an example.
|
|
Axis Properties
Vertical Ticks
Number of ticks to use on the vertical y axis scale.
Horizontal Ticks
Number of ticks to use on the horizontal x axis scale.
Fonts
Text Font
Font of the axis scales.
Border Properties
See Border Properties


