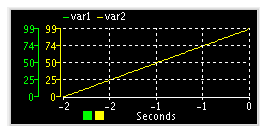

Plots up to ten connected variables against time.
This widget does not support user input.
See Geometry.
Background color of the plot.
Color of the grid.
Color of the time axis.
“printf” style numerical format used to format the y axis scale. HTML tags are not supported.
“printf” style numerical format used to format the time axis scale. HTML tags are not supported.
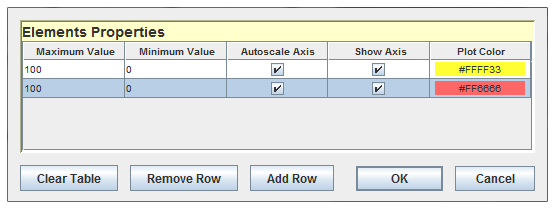
Table that defines the properties for each individual plot. The order of the entries in the table corresponds to the order of the connected variables. When this table is empty, the plot colors and axis properties default to default colors and the axes auto-scale.
Edit the entries in the table by clicking on the  button. The following dialog will appear:

Each entry has the following properties:
Maximum expected value of the data when not auto-scaling the axis.
Minimum expected value of the data expected when not auto-scaling the axis.
Whether the maximum and minimum value for the Y axis are adjusted automatically to the maximum/minimum range of the data.
Show the y axis for this plot.
Color of this plot line.
Number of ticks to use on the vertical y axis scale.
Number of ticks to use on the horizontal time axis scale.
Number of data points to display. The number of data points is related to the time span displayed by the plot via the following equation:
Time span (seconds) = (Number of data points)/(frame rate Hz))
When the test runs at a 1 milli second frame rate, 1000 data points will show 1 second worth of data on the plot.
The font to use to display the axis scales.
Clicking the mouse on the square corresponding to a variable will toggle the visibility of the variable’s plot.
When the control key is is held down while clicking on the square, the y axis is set to auto-scale and the maximum and minimum values of the variable are reset.
Clicking on the maximum or minimum vertical axis values will cause an entry field to appear where a new maximum or minimum limit value for the vertical axis can be entered.
The corresponding vertical axis auto-scale property will be reset.

|
HTML Browser | y Vs x Plot |

|