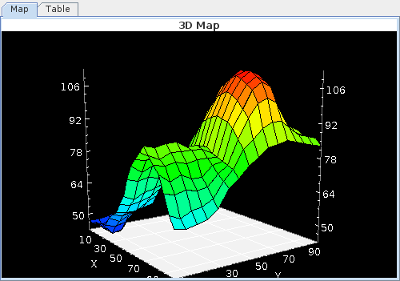

Displays a 3D map representing the data associated to a 2 dimensional matrix value of the connected variable.
This widget will show the associated data as a 3D surface as well as in table form in the table tab.
The 3D surface widget can be rotated up/down and left/right by clicking and dragging the left mouse button. It can be zoomed in and out by using the mouse wheel.
The side control panel can be displayed by hitting the F2 key while the focus in on the widget.
The refresh of the map display can be toggled by hitting p while focus in on the map.
The data in the table can be edited on the fly by editing cell entries in the table or adding an offset and/or multiplying by a gain to a group of selected cells.
When the table is configured as editable, the user can update the RTDB with the values he entered by clicking on the Update RTDB button.
See Geometry.
Visual Properties
Properties associated with the way the widget shows.
Whether to display the side panel to customize the display interactively.
Whether the title is shown or not.
The title to display in the widget.
Whether to display the mesh on the surface.
Whether to show a cube box around the surface.
Whether to display the widget as 3D Surface/ Wire frame/ Contour or Density plot.
Colors

Some of the display colors for the widget
The color to fill the background.
The color to use to paint the axes.
Axis Properties
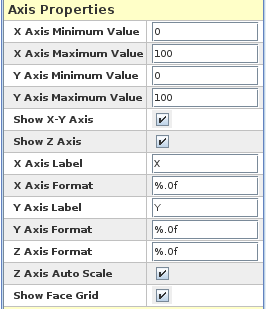
The minimum value to display on the X axis.
The maximum value to display on the X axis.
The minimum value to display on the Y axis.
The maximum value to display on the Y axis.
Whether the axis in the horizontal plane should be shown.
Whether the vertical value axis should be shown.
The text / legend to display along the X axis .
The 'C' type format to use to display the value at the X axis tick marks.
The text / legend to display along the Y axis .
The 'C' type format to use to display the value at the Y axis tick marks.
The 'C' type format to use to display the value at the Z axis tick marks.
Whether the scale of the vertical axis should be reset every time the data is updated.
Whether a grid should be shown in the horizontal plane.
Table Properties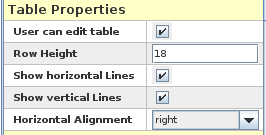
Whether the user is allowed to modify the table at run-time.
The table row height in pixel.
Whether to show the table horizontal grid lines.
Whether to show the table vertical grid lines.
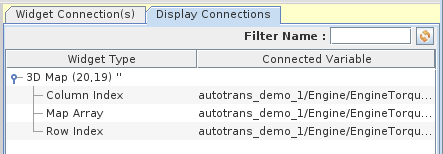
Connected VariablesUp to 3 RTDB variables can be connected to the widget. The first variable must always be connected to a 2 dimensional matrix that contains the data displayed as a 3D surface.
|

|
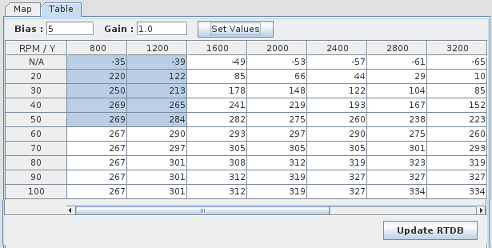
The Data table can be modified by editing table cells in place or by specifying an offset / gain combination to apply to a group of cells. The group of cell is specified by selecting them in the table.
Once a selection has been made in the table, the Set Values button will be enabled. Clicking on the button will set modify the table local data.
Clicking on the Update RTDB button will set the modified values in the RTDB. The 3D surface should reflect the changes in the RTDB automatically once the
next refresh from the RTDB has been received.

|
Image Table | HTML Browser |

|