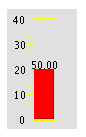
Displays the connected variable as a partially filled bar graph.
It can optionally be configured to accept data entry from the user to set the value of the connected variable.
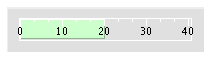
A horizontal Bar Graph with inside scale:
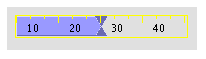
A horizontal Bar Graph with user input enabled:
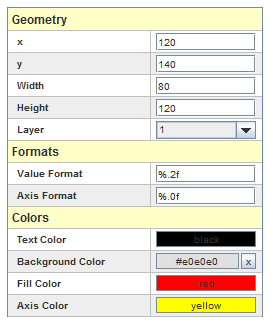
See Geometry.
“printf” style numerical format used to format the value. HTML tags are not supported.
“printf” style numerical format used to format the axis scale. HTML tags are not supported.
Color of the labels.
Background color of the widget. When the color is set to none by clicking on the  button, the background color or image will show in the back of the widget.
Color of the bar that indicates the value.
Color of the axis and the frame around the bar.
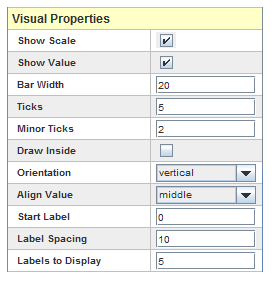
Display the scale on the side of (or inside if the Draw Inside property is selected) the bar graph.
Show the value of the variable.
Width of the bar in pixels.
Number of major ticks in the scale, including the endpoints. So, to put major ticks for a range of 0 to 100 units at every 20 units, use (100-0)/20+1=6 ticks.
Number of minor ticks between major ticks. So, to put a minor tick every 5 units where major ticks are separated by 20 units, use 20/5-1=3 minor ticks.
Draw the scale on the inside of the bar instead of outside.
Orientation of the bar (horizontal or vertical).
Align the value to the bottom, top, or middle of the bar graph when drawn.
Value to start labeling the scale values. Typically, this is the same as the minimum value. To skip labeling the lowest major tick, set the start label to be the value of the next higher major tick.
Spacing in units of the connected variable for successive labels. To label every other major tick, set label spacing to twice the unit distance between major ticks.
Number of labels to display starting at Start Label value. Typically this value is equal to the number of major ticks if every major tick is being labeled. If every other major tick or the end points are not being labeled, adjust the number of labels accordingly: (maximum label - minimum label)/spacing between labels + 1.
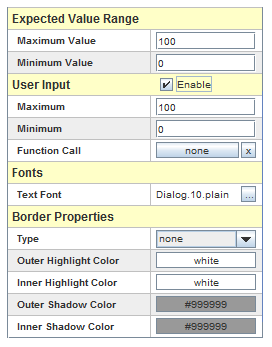
Maximum expected value for the connected variable. This is the highest value displayed by the bar graph.
Minimum expected value for the connected variable. This is the lowest value displayed by the bar graph.
Allows the user to enter a new value for the associated variable. New values may be input in three ways:

Maximum value that can be input for this value. If the value provided is greater than this maximum, an error message dialog is shown and the value is not sent to the real-time host.
Minimum value that can be input for this value. If the value provided is less than this minimum, an error message dialog is shown and the value is not sent to the real-time host.
Font of the value and scale’s text.

|
Table of Values | Text Table |

|